Carlo Passeri 先生为大岩资本姊妹公司Jasper Capital HongKong公司的产品和投资者关系主管。黄铂先生为大岩资本的执行总监、投资经理。原文标题为: Mean Reversion in China(A 股均值回复)。
均值回复是金融市场的基本规律之一,但在A股市场不能简单套用其它市场的投资策略。A股市场具有散户为主、投资者的独特行为以及政策对市场机制的扭曲影响等有别于其他成熟市场的特性。尤其重要的是,政策对市场微观结构、激励机制进而对市场参与者的行为产生重要影响。本文研究A股特性如何影响均值回复,发现扭曲的政策导致市场微观结构的改变,进而削弱了市场整体的均值回复现象。做必要的调整后,均值回复现象才能显现出来。这个发现除了加深对市场的理解,也对研发基于均值回复的投资策略有重要的影响,即投资策略必须立足于A股的实际特征。
为便于原汁原味体现文章内容,敬请读者阅读下文。原文为Jasper Capital HongKong公司newsletter之2019-4月号文章,转载时略有删减。
Mean Reversion in China
Suffice it say that many global norms breakdown in China, or never existed, particularly when it comes to quantitative techniques and signals. This is the natural consequence of key features of the local market, such as policies that distort market mechanics, and from behaviors that are unique to Chinese investors; the majority of which of are households. One must understand how policies not only create winners and losers in equities, but also how policies alter the market microstructure and compel changes in incentives, and thus behaviors, of economic agents. For this reason,one cannot copy and paste Western-style, BGI-inspired, multi-factor models in China, and hope to succeed over the long term.
In this monthly research note, we explore how these unique features of the Chinese market distorts mean reversion, a staple strategy for equity investors, known throughout the investing world as a“transient by recurring phenomenon.” We prove that the manifestations of behaviors resulting from microstructure changes caused by distortionary policies erodes mean reversion. In proving this, we also find a solution to creating a viable signal that is significant and consistent.
The Reversion Signal
Reversion to the mean has been a statistical phenomenon noted in literature at least since Sir Francis Galton’s seminal works in the 1800s. In finance, mean reversion has been tested and implemented as a trading strategy across a variety of equity measures as well as asset classes since the early 1900s. If it is statistically significant in markets and a feature in financial time series, then it is only natural for quants to exploit this phenomenon. As such, the reversion signal has been a stately cornerstone of quantitative investing for decades.
In application, the reversion signal suggests that past price movements are negatively correlated to future prices and therefore can be predictive. Naturally, this depends on several factors,including your selection of time horizon as variability in time horizons exhibit diverse characteristics on the mean reversion property of prices.
For the purposes of our study, we will use 1-day and 5-day returns to forecast expected returns for the next trading day, given by:

where and
are the past daily and weekly returns,respectively, and are used to forecast the one-day forward expected return,
, given by:

We use the data set from 2009 to 2019 for the entire A-share universe, which was comprised of 1600 to 3500 stocks over the sample period. We will measure the predictive power of the reversion signal via its correlation to target returns; the information coefficient, . We measure this as the cumulative sum of
throughout our analysis to show the strength and stability of the predictive power of the reversion signal.
Reversion in China
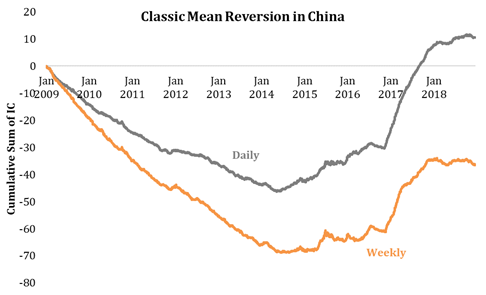
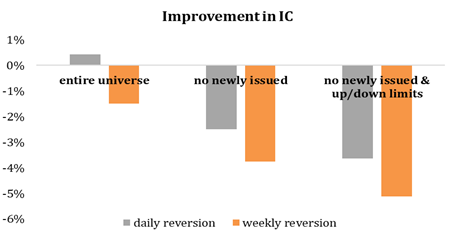
As the chart below shows, the reversion effectis unstable in the A-share market with and
of 0.4% and -1.5%, respectively. Recall that mean reversion implies that past prices should be negatively correlated to expected returns.

In 2014, the mean reversion signal became distorted (inflection point in the chart).
The turn from negative correlation (presence of mean-reversion) to positive means that something occurred in the market to caused past prices to become positively correlated with expected returns. Effectively, mean reversion has been squeezed out of the market. What happened? Enter the China Securities Regulatory Commission (CSRC)…
As part of a wave of financial market curbs, the CSRC set tight trading ranges for market, but implemented severe limitations on new issuances, which carry a stricter +/- 5% intraday trading band. This policy dramatically changed price dynamics, particularly when combined with other policies such as the ban on short selling, which together deleted a natural mechanism for efficient price discovery and was especially acute for newly issued stocks.
Within this context, the behavior in the chart above begins to make sense. If there is no short selling and no natural mean-reverting force in the market, then prices will drift to the maxima and minima. For example, a stock that consistently hits it upper limit is more likely to continue doing so (absent regulatory or fundamental headlines) due to the lack of mean reversion and given that the bulk of participants are retail investors that chase the market (reinforcing beta trends in both directions). This puts 2016 and 2018 into context perfectly. Mean-reversion works in both directions and its absence can yield market extremes.
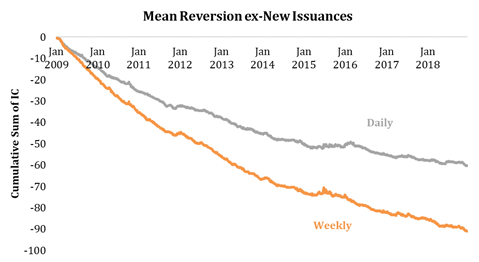
Like a surgeon to cancer, we remove new issuances, which only harm the functioning of the system. Excluding all stocks that have been listed for less than 30 days has a dramatic effect on the predictive ability of our model, as the chart below shows.

The reversion signal becomes significant AND consistent throughout the past 10-years once this transform is applied, with and
jumping to -2.5% and -3.5%, respectively. It is worth noting that the subset of equities removed only represented 0.7% of the entire investable universe. Small changes can have big impacts.
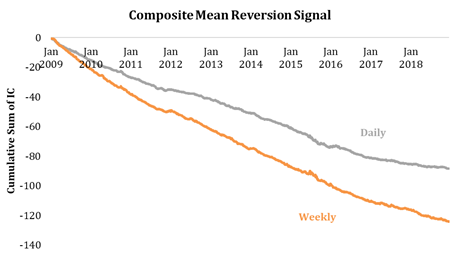
We can improve our signal further still by generalizing the above rule to exclude all stocks that hit up or down trading limits. The imposition of strict trading limits affects 1.7% of all A-shares,in the case of up-limits, and 1.0% of all A-shares, in the case of down-limits,daily. The final model captures a mean-reversion free of impurities caused by policy distortions.

To state again, one must understand how policies create winners and losers, but also how these policies change the market’s microstructure, the behavior of economic agents, and the path of prices.


深圳市福田区益田路5033号平安金融中心88层01单元
上海市浦东新区陆家嘴街道富城路99号 (震旦国际大楼)27层
香港中环德辅道中188号金龙中心17楼1701室