来源:大岩资本(ID:jasperam)

作者:Carlo Passeri & 冯赟
来源:大岩资本(ID:jasperam)
Carlo Passeri 为大岩资本姊妹公司Jasper Capital HongKong公司的产品和投资者关系主管,冯赟先生为大岩资本的量化投研副总裁。原文标题为: Signal Decay & Rotation - A Case Study with Fundamental Factors(信号衰减及轮换-基本面因子的一个案例研究),向其机构投资者发布于2019年6月。
編者按:
经常遇到的一个问题是,在量化投资模型中,如何进行移除或替换因子的决策,以及如何度量信号衰减及如何加入新的信号。在该文中,介绍了采用基本面因子连同“拥堵函数”(crowding functions)进行实证分析的方法。“拥堵函数”指的是用于度量信号衰减和帮助识别信号轮换变点的方法。
为便于原汁原味体现文章内容,敬请读者阅读下文。
Signal Decay & Rotation - A Case Study with Fundamental Factors
A recurring question we receive is how we inform the decision to remove/replace factors in our models, how we measure signal decay, and how we model integration of new signals into the production model. This month, we will illustrate our approach with a case study using fundamental factor in conjunction with crowding functions, which are methods we use to measure decay and help inform inflection points for signal rotation.
Factor Crowding
Crowding—the deterioration in returns due to the concentration of investors in the same trade—is a concern that tends to be concentrated in the BGI framework of the world and is symptomatic of the proliferation of smart beta products. This behavior is particularly acute in the United States. Smart beta products have yet to truly take hold in China, but the same crowding behavior can be observed given participant demographics and volumes, which compounds cultural proclivities for heard behaviors.
Case Study
We take the classic factor, earnings yield, as our case study since it is one of the most fundamental measures of equity prices used by all manner of investors, from fundamental analysts to the lovely quants. There is also an abundance of literature on its use as a predictor of returns, something that has been studied and debated for decades. Furthermore, literature has shown that once equity factor studies are published, their return profile deteriorates.
These two characteristics of the earnings yield factor are enough for us to assume that it is both adequate as a measure for expected returns and can be subject to crowdedness given its broad appeal to equity investors.
Our sampling method starts with a cross-section of signal exposures for a given period (monthly returns from 2008 to 2019), divided into percentile groups, and sorted in descending order based on signal strength. Graphical analysis of the cumulative return of each percentile group helps us to confirm our segregation of the factor family into more adequate performance categories upon which we will apply our crowding functions.
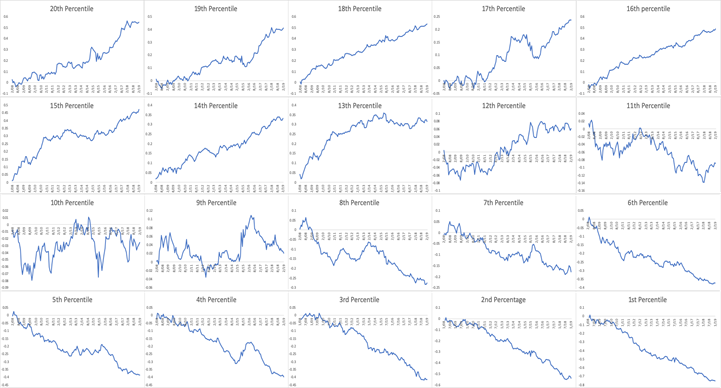
Since we are looking for inflection points, we can assume that when the market does turn, the performance of top and bottom percentiles will yield the greatest shift in relative value. Hence, these two subgroups should yield information about how investors perceive the expected return of each category. As we see in the charts below, the top and bottom percentile groups are starting to plateau.
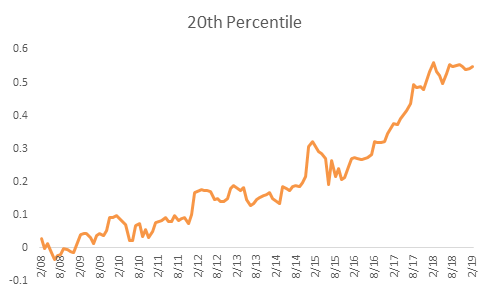
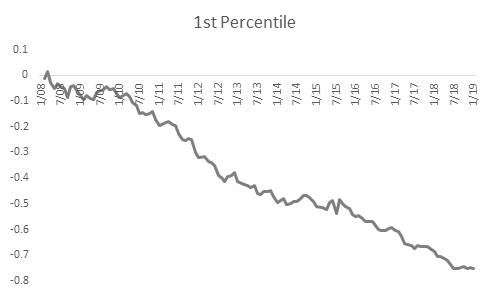
A ratio of the top and bottom percentile performers can be used to inform the rest of our analysis. From the chart below, we can see that the plateauing of the respective groups has already been priced. One can infer, that this is an inflection point and there is exhaustion in percolating the trade.
The question is what is driving this? How and why this is materializing will dictate how one leverages the information. There is much more analysis to be done. We consider the probability of crowding for the remainder of our analysis.
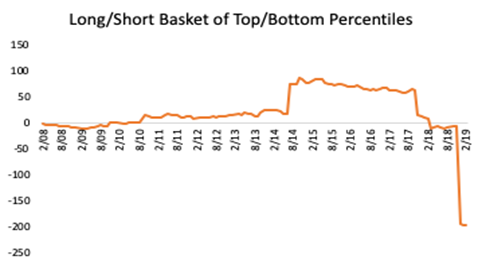
We focus on the this "long/short ratio and apply our crowding function measures—turnover and beta—based on our experience with the hierarchy of participants and penchants of certain investor segments. For example, the proclivity of retail investors to chase returns adds a behavioral bias that can be extracted and leveraged using relatively simple tools. Hence, turnover and beta, which are common measures by any standard, can become strong indicators of crowdedness.
When considering our crowding function measures, we seek to understand their linear relationship with signal ICIR, which measures the suitability and stability of expected returns. This allows us to gain an understanding of the implication of turnover and beta on the stability of expected returns for the top and bottom percentiles of the factor family. This will help us to understand what, or who, is driving performance.
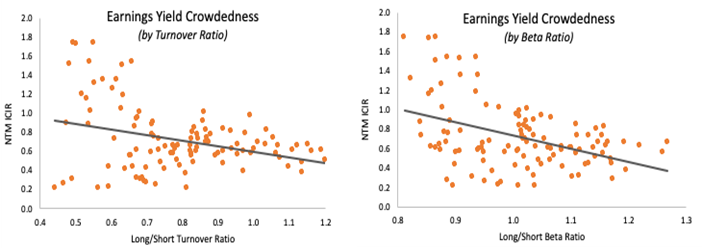
Corresponding to our initial assumption given by the long/short series at the factor family level, which showed trade exhaustion (figure 4), we also see that the turnover and beta ratios are negatively correlated with ICIR forecasts for the next twelve months (NTM). These models result with p-values of 0.000, showing statistical significance of using the ratios to explain forecasted expected returns.
A simple translation of this relationship is that higher turnover and higher beta segments are forecast to have less-stable expected returns over the next year. One can assume that the exhaustion at the factor family level is from active traders and those who have been chasing performance. Thus, there is a higher probability that the deceleration in returns will cause these active traders to reduce positions and chase returns elsewhere.
In practice, things are not always so clean.
We can repeat the same methodology for sales growth (skipping a few steps for expediency), a factor where positive values do not always translate to positive effects. For example, the desire to capture market share to the detriment of the balance sheet is a common business model in China. A perfect example is BYD, who is growing sales but can barely earn a nickel given its high costs and debt load.
The main charts are below.


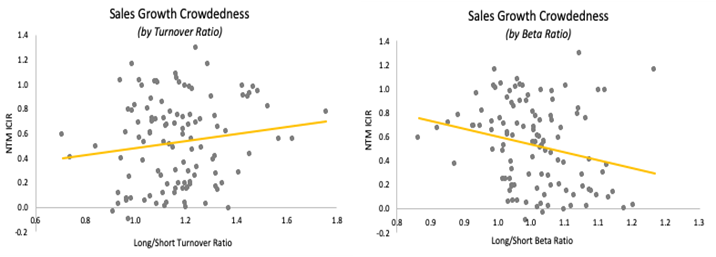
We find that the behaviors are different than those observed for earnings yield with the ratio notably indicating that there is little evidence of decay at the factor family level. So, maybe, the current configuration is suitable to remain as is. But first we assess the crowdedness of the top and bottom percentiles as we did previously.
From the below we can see a divergence relative to our analysis of earnings yield. Active trading is expected to still yield stable expected returns whereas the percentile’s return relative to the market is expected to become less stable over the next year. The signal to rotate is obfuscated.
What can we do with this information?
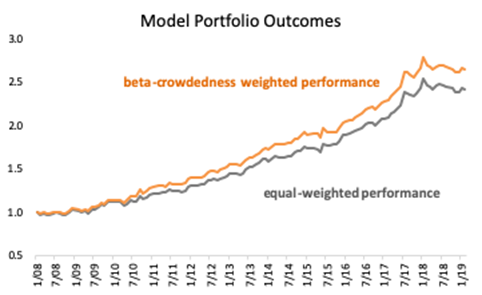
We can plug these into a two-factor model to test the results of using factor crowding as a measure for improving a traditional model. We will exclude turnover from this analysis as the usefulness of the measure across the two factors is negated due to the diverging indicators. We use the spectrum of Beta-Crowdedness Ratios as weights inversely proportional to ICIR.
![]()

深圳市福田区益田路5033号平安金融中心88层01单元
上海市浦东新区陆家嘴街道富城路99号 (震旦国际大楼)27层
香港中环德辅道中188号金龙中心17楼1701室